Tracking every turn of the stock market can be an exhausting game. Awareness of the primary trend, whether bull or bear, can significantly impact the compounding of wealth over time.
Summary:
The current bull market started around 2012-2013. Over the past 100 years, three significant bull and bear markets have existed. The averages of these cycles suggest this bull could last until 2028 or 2029. However, this does not mean that stocks will be immune to pullbacks.
The big-picture view is based on the averages of the six cycles listed below.
The Details:
Bear Markets Since 1929:
Jan 1929 – July 1942: 13.6 years | Total Return: ~ -69% | Max Drawdown: ~ -86%
July 1968 – Jan 1980: 11.6 years | Total Return: ~ +4% | Max Drawdown: ~ -44%
Jan 2000 – July 2012: 12.6 years | Total Return: ~ -8% | Max Drawdown: ~ -57%
Total Bears: Avg: 12.6 years | Avg. Total Return: ~ -24% | Avg. Max Drawdown: ~ -62%
Bull Markets Since 1929:
Jan 1954 – July 1968: 14.6 years | Total Return: ~ +274% | Max Drawdown: ~ -28%
*If we cherry-pick July 1942, it would extend the overall average. This was also the end of a global depression and WWII.Jan 1980 – Jan 2000: 20 years | Total Return: ~ +1,259% | Max Drawdown: ~ -56%
July 2012 – Current: 12 years | Total Return: ~ +297% | Max Drawdown: ~ -35%
Total Bulls: Avg: 15.53 years | Avg. Total Return: ~ +610% | Avg. Max Drawdown: ~40%
The current bull market has been underway for 13 years and has returned about +297%. This compares to the average bull market of 16 years and +610%.
Comparing Averages:
Time: We are about 73% of the way through a typical bull market.
Price: We are 48% of the way, or about halfway.
These points are not intended to be predictions but to help shed light on likely probabilities. Understanding probable outcomes can help us make less emotional decisions based on news headlines or a few weeks of price action.
Historical Context:
The S&P Index chart data goes back to the 1870s, though it’s less relevant as we didn’t have a developed stock market until the 1920s. Still, there are a few similarities to note:
Wildcat banking was prevalent in the 1860s leading to the US dollar. This period is similar to today’s Bitcoin/Crypto markets.
At the turn of the 20th century, Industrialization was shaking things up as much as Digital/AI is today.
The geopolitical and legal environment of the early 1900s, 1907-1913, led to the creation of the FED. Global political tensions between 1914-1925 boiled into WWI and later WWII. Tensions today between the US/China/Russia and the Middle East are similar and show signs of WWIII on the cyber front.
The Trend of Stocks:
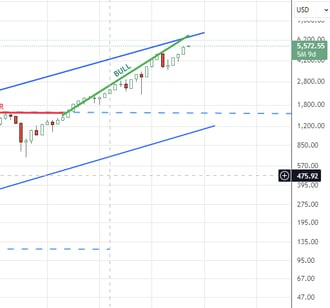
Over the last 100 years, stocks have had numerous wild swings but overall have traded within a clear uptrending channel.
Only twice have we touched the upper bounds of the channel, in 1929 and 2000.
Today, we are nearing the upper side of the technical channel at the same time price is 3 standard deviations from its trend.
Optically, the view looks and feels expensive. Yet, strong markets like the current one can grind this way for long periods.

Time Perspective:
We’re 12 years into a bull market. Considering the average bull market lasts 16.4 years, we appear to have time to buy dips.
Probability Perspective:
While a correction within the general bull trend feels due, we should stay the course unless several support levels are taken out. As the saying goes, “The trend is your friend.” Technical support levels are discussed at the end.
If there is a pullback and it continues deeper, it may indicate the bull market has stopped short of the average time. We’d need to see several technical support levels broken first.
In this case, it may lead to a period similar to 2000-2012 or 1968-1980, where stocks go nowhere due to large up-and-down moves in between.

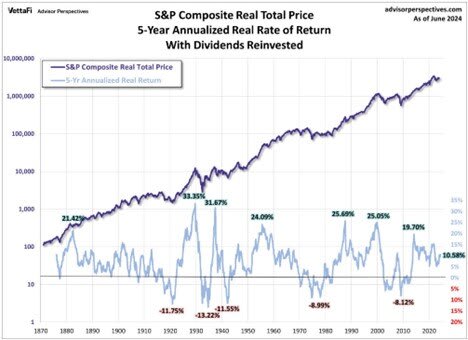
From a distance, the S&P appears to rise continuously (purple line), but in real-time, the ups and downs feel much choppier (blue line).
To Summarize:
We still have bull market vibes and are probably in the back half of buy-the-dip mode.
The S&P 500 is touching the upper side of a technical channel dating back to 1929. One that initiated with the Panic of 1907, an important event that led to much of the financial system we use today.
In terms of price, we are 3 standard deviations above trend, warranting the calls for an "expensive" market.
Historically, once a bull market starts, we do not cut into the highs of prior market tops, as noted by the dashed blue lines. Putting this into perspective, the current bull market could pull back to around $1,576 in the S&P and still be within the bounds of this “bull market cycle” that started in 2012.
Technical Support Levels for the S&P 500:
5,300
5,000
4,500 to 4,600: Below this, the uptrend that started in 2022 would come into question.


