Update: Bitcoin Shines Amidst US Banking Crisis
Bitcoin Fundaments are positive and the 4 year halving cycle remains on schedule
In 2023, traditional financial markets picked up right where the Crypto Crash left off. The past few years have seen a reintroduction of systemic risks. The crypto crash, bank failures, bond routes, and equity volatility have brought back memories of 2008-style collapses. No market has gone unscathed, and each has spent its time on the front page.
What started with destruction of crypto hedge funds in 2022, led to a dismantling of crypto exchanges, and other centralized providers. Markets settled for a brief period before spilling over into equities and bonds as the FED remained unable to get in front of bouts of inflation and deflation amidst currency wars across the global financial system.
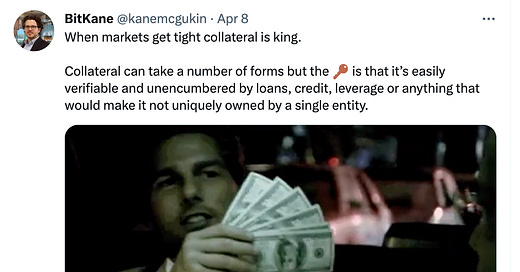
While money can take many forms, in times of crisis, collateral is king. Collateral in times of fear are assets that are easily verifiable and unencumbered by loans, credit, leverage, or anything that would make it not uniquely owned by a single entity.
Whether it is in digital assets, equities, bonds, or fiat currency, we’ve seen collateral runs in them all over the past few years.
The challenge with investing is falling in love with the story. There’s never a shortage of narratives to tango with these days.
A principle to follow is that sound foundations weather the storm. Diversifying across 7 ventures, while not sexy, might be the wisdom most are looking for. As we’ve witnessed, misfortune is bound to occur.
Recall that Forbes once touted Elizabeth Holmes (Theranos), Sam Bankman-Fried (FTX), Adam Neumann (WeWork), and Silicon Valley Bank (2023 Best Banks List).
All told a great story but were built on levered sand rather than sturdy rock.
The Bitcoin Perspective
Regardless of how or why, the dollar is still the reserve asset for the system and it bears the broadest and deepest financial network. This means all other assets are still priced relative to it. That said, other assets generally tend to trade the opposite of the dollar. Bitcoin, in that regard, is no different.
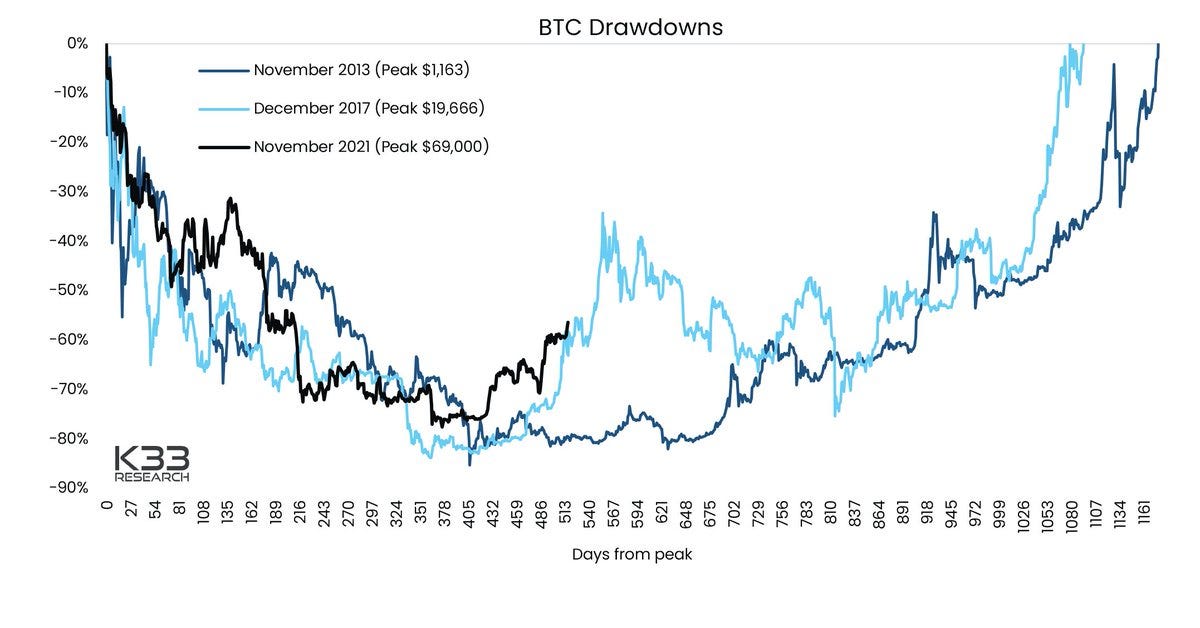
For the bulk of Bitcoin’s life (14 years), the dollar has been in significant decline. Until recently. Over its life, Bitcoin has traded sharply up though it has had numerous 60-80% declines as we saw in 2022. Later, we’ll discuss the normality of this. It’s primarily caused by Bitcoin’s 4-year halving cycle.
In 2022, Bitcoin faced another significant drawdown, though there are a couple of points worth noting. It turns out that BTC is *not* the inflation hedge it’s dubbed to be, but rather a signal for inflation yet to come.
More importantly, as trouble and systemic rumors began to rumble Bitcoin along with gold proved their value as sound money assets.
When banks began to fail (Silvergate, Silicon Valley Bank, Signature Bank, First Republic, and Switzerland’s 167-year-old Credit Suisse) Bitcoin rose about +87% and gold a little over +12.5% into their local highs. The action of these assets proves that while no asset is perfect, each serves a purpose. Depending on one’s timeframe, their need for capital is what dictates “return”.
For most, the easiest route is the one with the least number of options. In that regard, understanding there are only five asset classes can help. There are: Stocks, Bonds, Currency, Commodities, and now Digital Assets. Spreading funds based on our needs across time will likely give us the best, blended return.
The Power of Boring: Dollar Cost Averaging
Dollar cost averaging, buying in both good and bad times, isn’t exciting but it works. It’s the hare in the Tortoise and Hare story. To make the point, I looked at Bitcoin, Stocks, and Bonds and graphed a DCA line versus a lumpsum buy.
In each case, I looked at buying that top (lumpsum buy) or buying the high every other week. Continuing to purchase the same dollar amount across time - DCA. You can easily see the difference between doing DCA vs. buying once and adding no additional capital to the position.
Financial Markets: A Mix of What We See and Feel
Rolling returns are an important concept but not often discussed in the daily gyrations of the markets. Instead, what news outlets and financial commentators most commonly refer to is the S&P 500.
As you can see, the index seems to go up most of the time. 2/3rds of the time is a good gauge. However, most of our needs are much shorter in nature and can, unfortunately, come in a period when the market may be down.
The lower half of this chart (Advisor Perspectives) provides great insight to more of what we “feel” rather than what we “see”, as it relates to the market. The lower portion of the chart shows 10-year returns along with a noticeable trend. When the 10-year return is at or near double digits markets may get bumpy for a period of years before the average is in the mid to high, negative, single digits. There is no guarantee, but this gives visual credibility to the cycles we hear discussed by market commentators.
The ups and downs of the cycles are what we feel in our accounts, more so than the upward slope of the broad market index. The good news is that while the S&P500 has gone both up and down by roughly 10% over the past year, it has also effectively gone nowhere at the same time. The index has been stuck in a range between 3,600 and 4,200 since May 2022. Given the news headlines, this is something to be at least slightly positive about.
The Fundamentals of Bitcoin Remain Intact
Even though we’re in the depths of a typical Bitcoin bear market, this is not abnormal. It follows the 4-year halving cycle. As cracks began to show in the traditional markets and publicly traded banks began to fall, Bitcoin rallied the hardest. When it was Bitcoin’s time to shine it did which helps explain how and why sound money assets fit into the overall portfolio even if they underperform for periods of time.
Each asset class tends to have its own unique characteristics and does better or worse depending on the overall environment. The last few years, we’ve seen a little bit of everything condensed into a small window creating a bit of chaos for all assets.
The important point to remember is that the supply of bitcoin is limited. Per code, there will only ever be 21,000,000 bitcoin. Every 10 minutes a new block is mined which contains transaction fees + 6.25 bitcoin (currently). The next halving will be roughly May of 2024 and the amount of bitcoin in each block will reduce to 3.125. Every four years, the amount of bitcoin included in each block reduces by half until the final, 21,000,000th, is mined in the year 2140.
This is sound money. A defining characteristic of Bitcoin and how it gets the label of digital gold. Both are scarce assets that allow them to act like stores of value and it’s what makes them different from dollars or other fiat currencies whose supply can increase or decrease at will. In simple terms, there is no arbitrary printing of Bitcoin or gold.
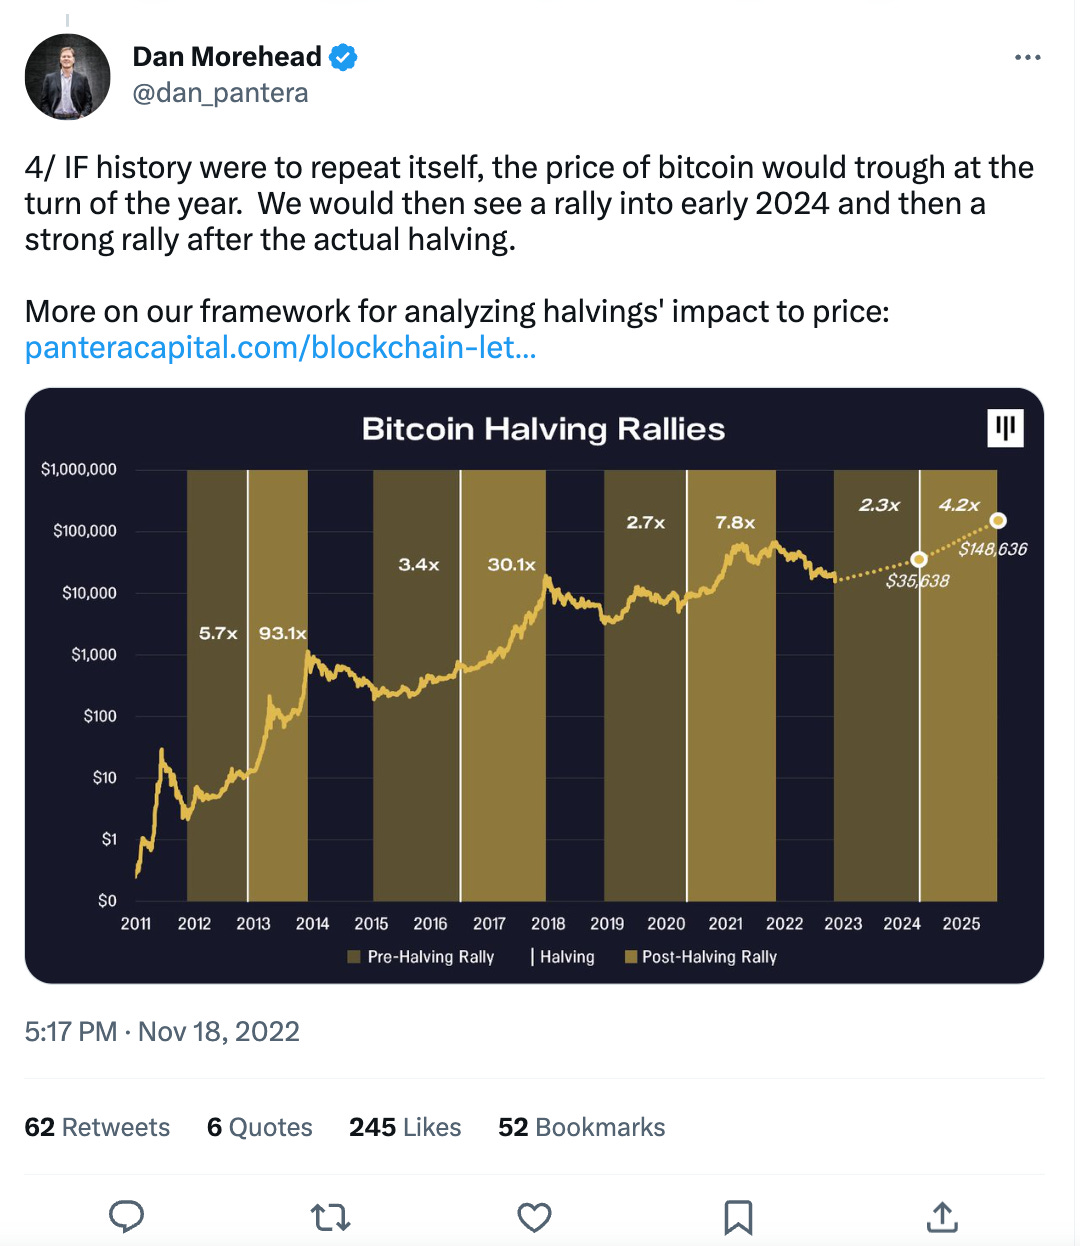
A simple chart of Bitcoin halving’s from one of the first crypto hedge funds, Dan Moorehead’s Pantera Capital. Dan also stated:
“Over the years we have stressed that the halving is a big event – but it takes years to play out. The typical trough is 1.3 years before the halving and, on average, the market peaks 1.3 years after. The whole process has taken 2.6 years to see the full impact.”
We are on schedule and right in this window.
Wallet growth is important to Bitcoin. Think of a wallet address much like we would an account you hold dollars, stocks, or bonds in. Over the life of Bitcoin, wallets have continued to grow, indicating that users continue to join the network. The important point here is that as network growth continues it encourages more users to join so they can also participate with the other users they know.
In this regard, this is what we learned from social media platforms like Facebook which was the first to really teach us the power of network effects.
Hodl waves are important to Bitcoin as they indicate how long various parts of the market are holding their coins. The longer the holding the more conviction it indicates. It’s great for a macro view of the market’s sentiment. Long-term holders are those that have held coins for greater than 1 year. Per the chart, those holders now represent >65%+ of all Bitcoin supply. So, in Bitcoin terms, most participants are “staking sats” and not selling.
Another metric that provides a good idea of Bitcoin’s relative position, whether it is near a top or bottom, is Realized Value RVT. As you can see here when the reading is less than about 0.02 Bitcoin cheap (late 2022/early 2023), and when it’s near .08 or higher it is expensive (2018, periods in ‘19 & ‘20, 2021).
During normal periods, leverage in the system is a little less relevant. However, given the destruction and liquidations caused by leverage in 2022 and 2023, it’s always good to have some idea as to the amount that has built up in the system. Regardless of the market, leverage is a good metric to be aware of because as we’re seeing currently with the bank failures it can get ugly quickly.
In the chart above, we see Bitcoin’s recent rally has happened while futures open interest has continued to decline. Futures are a tool typically used by more experienced professionals to leverage their position for larger gains, but also in many cases they end up creating unstable environments. There’s plenty of financial crisis history that outlines the dangers that come with this territory and at the moment it is looking healthy for Bitcoin.
One Final Note
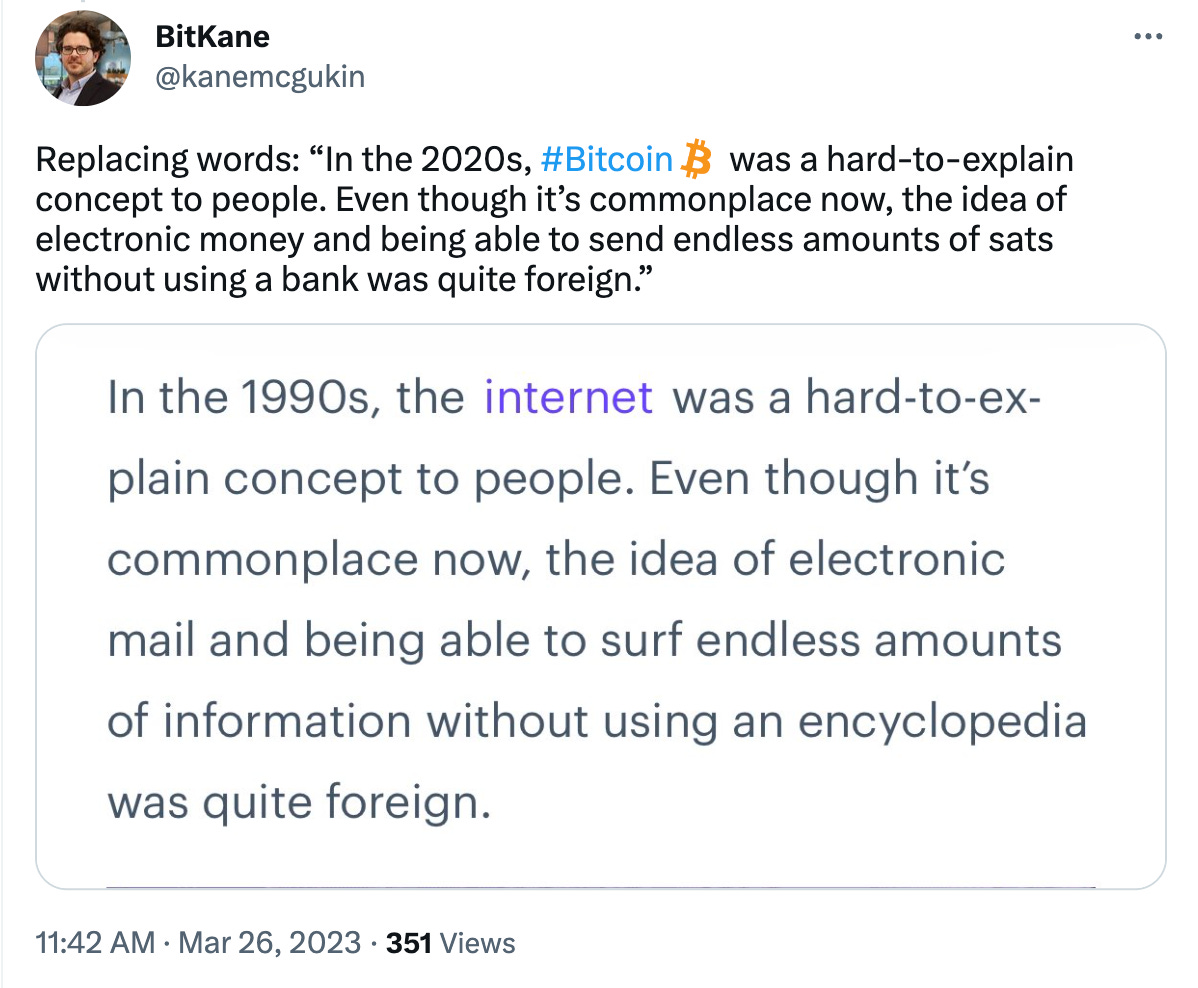
The Next Web had a quote that sums up the future potential of Bitcoin and if we rewrite it, it can help us make better sense of Bitcoin’s future potential as an economic network.


